

If you’re starting your journey into Forex trading, you might have stumbled upon the term “technical analysis” and thought, “What is this wizardry?”
Don’t worry, we’ve all been there!
Today, we’re diving into the world of technical analysis in Forex trading, breaking it down in simple terms, and yes, we’ll sprinkle in some memes for your enjoyment.
So grab a cup of coffee (or tea, we don’t judge), and let’s dive into how technical analysis can help you make better trading decisions in the forex market.
What Is Forex Trading?
Before we get into technical analysis, let’s remind ourselves what Forex trading is.
Forex (foreign exchange) trading involves buying and selling currencies to make a profit. The goal is simple: buy a currency pair at a low price and sell it at a higher price.
Think of it like a giant global marketplace where you can buy and sell currencies from countries worldwide.
The value of these currencies can change based on various factors, such as economic news, geopolitical events, interest rates, and, yes, you guessed it, technical analysis!
What Is Technical Analysis?
Technical analysis in Forex trading evaluates currencies by analyzing historical price movements and chart patterns.
In other words, it’s like looking at a currency’s past performance to predict its future behavior. It’s not about guessing where the market will go but rather studying patterns and trends to make informed predictions.
Technical analysts (or chartists, if you want to sound fancy) use tools like charts, indicators, and patterns to assess past price movements and forecast future price trends.
If you want to predict whether a currency will go up or down, technical analysis based on historical data can help you make that call.
Why Does Technical Analysis Matter in Forex?
Now, why is technical analysis so important in Forex trading? Imagine trying to play a video game without knowing the controls or strategy. It’s not going to go well.
In Forex trading, technical analysis serves as your game plan, helping you navigate the unpredictable world of currency trading.
Technical analysis can:
- Identify trends – Spotting the market’s direction (uptrend, downtrend, or sideways).
- Find entry and exit points – Knowing when to buy or sell a currency.
- Measure market sentiment – Understanding whether the market is bullish (optimistic) or bearish (pessimistic).
- Provide risk management – Setting stop-loss levels and profit targets to minimize losses and lock in profits.
Common Tools Used in Technical Analysis
To make all these predictions, Forex traders use a bunch of cool tools! But don’t worry, it’s not as complicated as it sounds. Here are the main tools:
1. Charts
Charts are the foundation of technical analysis.
They show the price movement of a currency pair over time.
There are different types of charts—line, bar, and candlestick.
The candlestick chart is the most popular and looks something like this:
Each “candlestick” shows the open, high, low, and close prices during a set period, like one minute, hour, or day. It’s like a little piece of history telling you the price movement story.
2. Indicators
Indicators are mathematical calculations based on price and volume. They help traders spot trends, momentum, and volatility. Some popular ones include:
- Moving Averages: These smooth out price data to help identify the direction of a trend.
- Relative Strength Index (RSI): Measures whether a currency is overbought or oversold.
- Bollinger Bands: The volatility and price levels relative to a moving average.
3. Support and Resistance Levels
These are key price levels where the market tends to reverse. Think of it like a ceiling (resistance) or a floor (support) for the currency price. Traders often use these levels to set their buy or sell orders.
- Support is where the price tends to find a “floor” and bounce back up.
- Resistance is when the price hits a “ceiling” and reverses downward.
Candlestick Patterns: The Language of Traders
Now that we’ve covered the basics, let’s get into one of the coolest aspects of technical analysis—candlestick patterns. These little symbols form a chart and help traders predict future price movements.
Here are a few common candlestick patterns you might see in Forex trading:
1. Doji
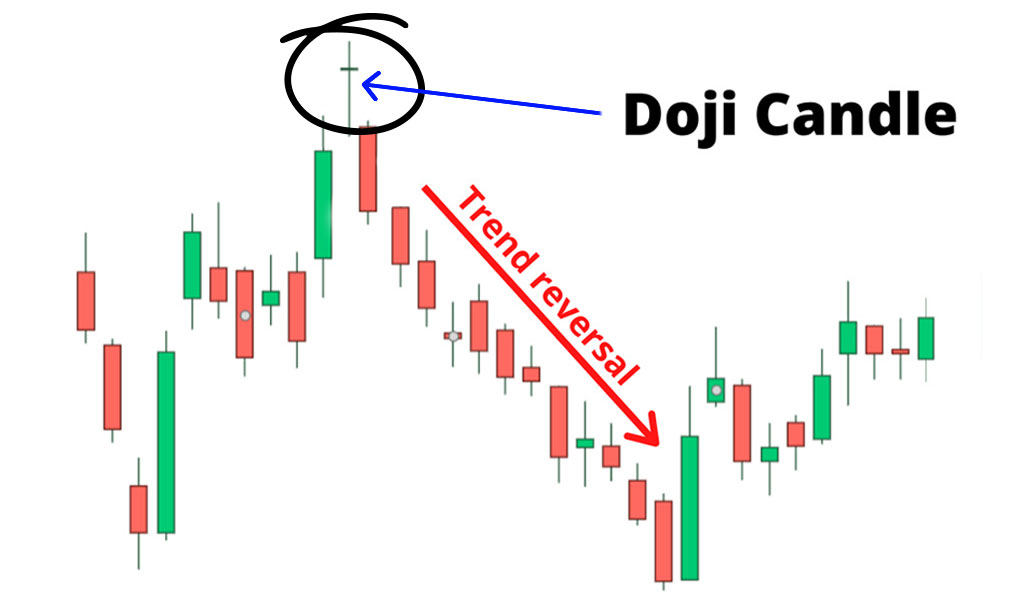
A doji occurs when the open and close prices are very close or the same. It signifies indecision in the market—traders are unsure whether the price will go up or down.
2. Hammer
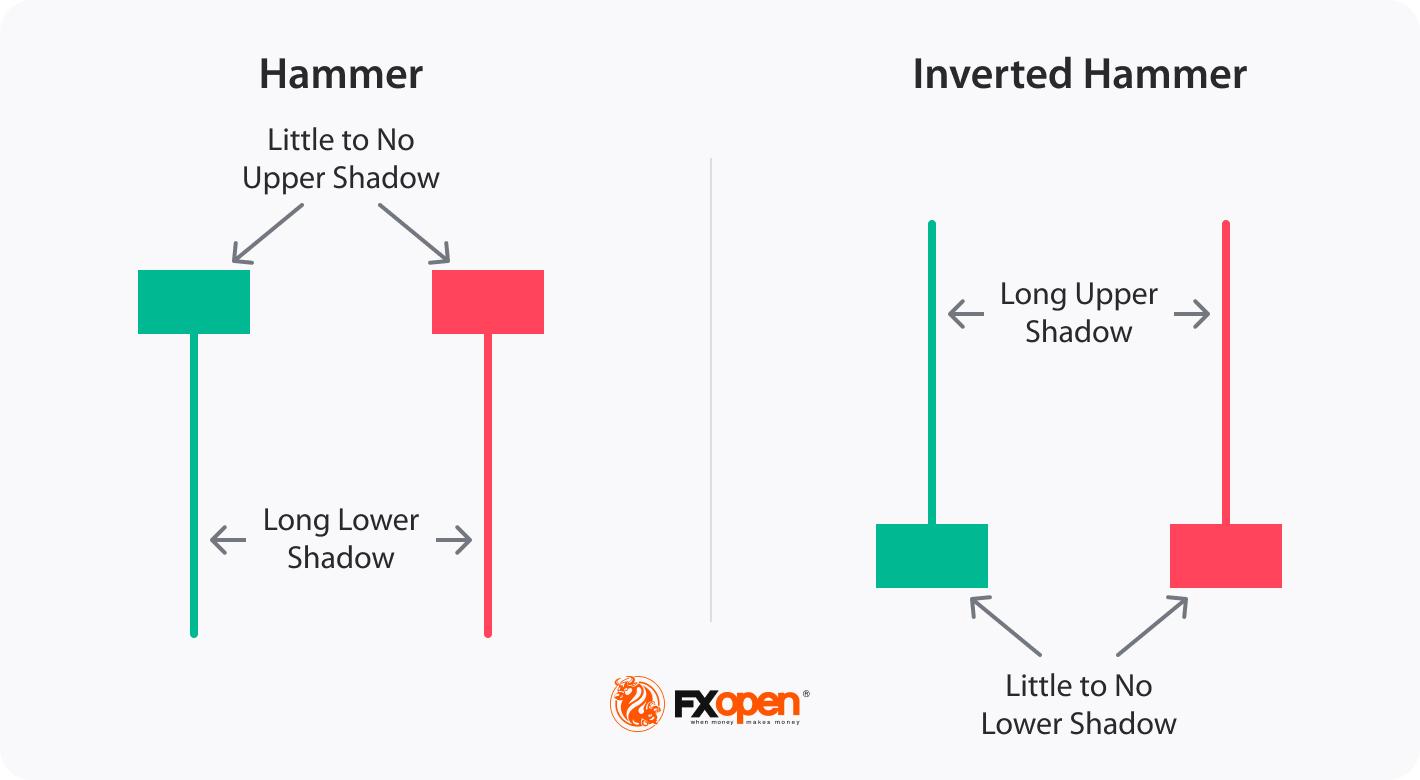
The Hammer is a bullish reversal pattern that occurs at the bottom of a downtrend. It suggests that the price is likely to rise.
3. Engulfing Pattern
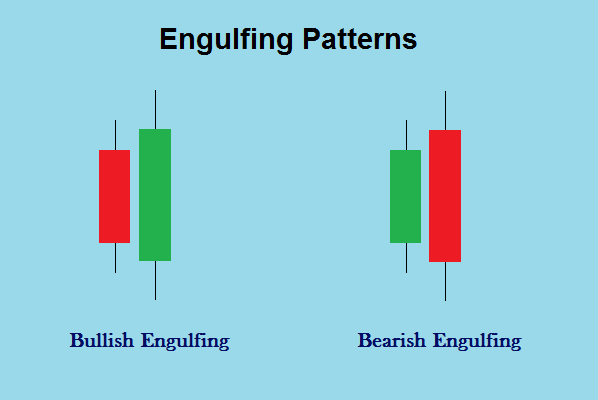
This is when one candlestick completely engulfs the previous one, signaling a potential reversal. If it’s a bullish engulfing pattern, the price might go up; if it’s bearish, the price might go down.
The Power of Trendlines
In technical analysis, identifying trends is key. One way to do this is by drawing trendlines. These straight lines connect price points and help you identify whether the market is in an uptrend, downtrend, or sideways trend.
How to Draw a Trendline:
- Uptrend: Draw a line connecting the lows of an upward price movement.
- Downtrend: Draw a line connecting the highs of a downward price movement.
Trendlines are like the map that guides you through the jungle of the Forex market. If your trendline goes up, the market will likely keep moving in that direction!
Risk Management: It’s Not All About the Wins
Okay, we’ve talked a lot about charts and patterns, but here’s the truth: trading isn’t always about making huge profits. The most successful traders are the ones who manage risk effectively. This is where tools like stop-loss orders and take-profit orders come into play.
- Stop-Loss: Automatically sells your position when the price hits a certain level to limit your losses.
- Take-Profit: Automatically sells your position when the price reaches a certain profit level.
Remember: trading is like driving a car. You wouldn’t drive 100 mph without wearing a seatbelt. Think of stop-loss and take-profit as your safety features on this wild ride.
Common Mistakes in Technical Analysis (and How to Avoid Them)
Even seasoned traders make mistakes. Here are some common ones, with solutions for how to avoid them:
1. Over-Reliance on Indicators
Don’t put all your eggs in one basket. While indicators are useful, they shouldn’t be the only tool you rely on. Use them in combination with other methods, such as chart patterns and support/resistance levels.
2. Ignoring Risk Management
Getting excited about a trade is easy, but never forget the importance of managing your risk. Never risk more than you can afford to lose, and always set stop-loss orders.
3. Chasing the Market
Don’t rush into trades just because you think you’ve missed out on an opportunity. Patience is key in Forex trading. Wait for the right setups to align.
4. Not Practicing Enough
Just like any skill, Forex trading requires practice. Use demo accounts to test your strategies and get a feel for the market before putting real money on the line.
Final Thoughts: The Secret Ingredient
So, what’s the secret to becoming a successful Forex trader? It’s a combination of knowledge, patience, and yes, technical analysis! The more you practice, the better you’ll get at reading charts and spotting trends.
Remember, there’s no magic formula for predicting every market move, but with technical analysis, you’ll have a better chance of making informed decisions. And don’t forget, even when the market seems confusing, some humor and some memes can go a long way in keeping things lighthearted.
Happy trading, and may your pips always be in your favor!
